
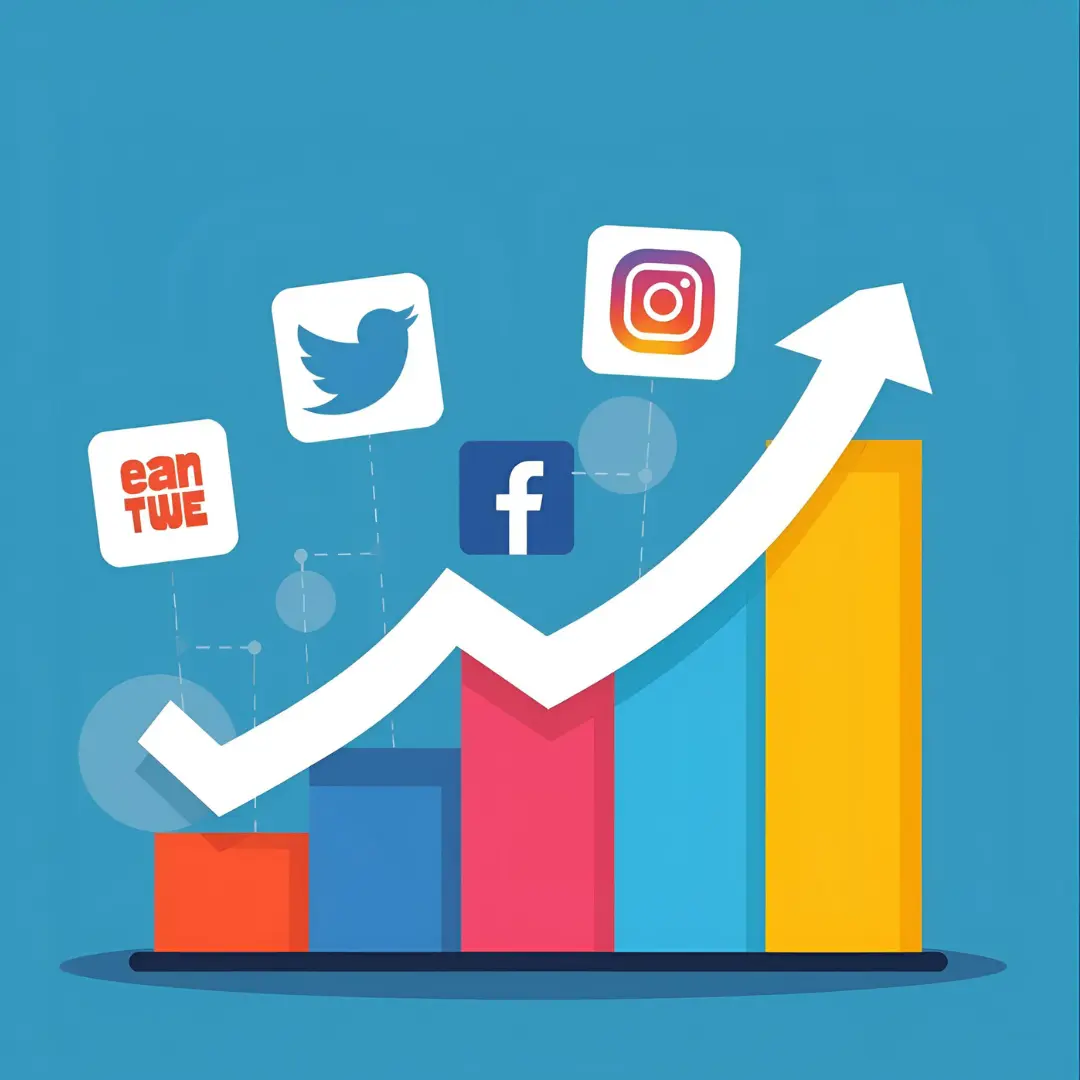
Social Media Strategy for Small Business Philippines: Complete Framework for Digital Success, Growth Planning, and Market Leadership
Learn how to develop and implement effective social media strategies specifically designed for small businesses in the Philippines, maximizing engagement and driving sustainable growth with limited resources.

Facebook Ads vs Organic Marketing: Which Works Better Locally? A Comprehensive Analysis for Business Success
Explore the critical differences between Facebook Ads and organic marketing to determine which strategy delivers superior results for local businesses seeking sustainable growth and customer engagement.

Local SEO Services Philippines: Your Complete Guide to Dominating Local Search and Attracting Nearby Customers
Professional local SEO services in the Philippines help businesses dominate local search results, connecting them with nearby customers actively searching for their products and services.
Social Media Strategy for Small Business Philippines: Complete Framework for Digital Success, Growth Planning, and Market Leadership
Learn how to develop and implement effective social media strategies specifically designed for small businesses in the Philippines, maximizing engagement and driving sustainable growth with limited resources.
Facebook Ads vs Organic Marketing: Which Works Better Locally? A Comprehensive Analysis for Business Success
Explore the critical differences between Facebook Ads and organic marketing to determine which strategy delivers superior results for local businesses seeking sustainable growth and customer engagement.
Local SEO Services Philippines: Your Complete Guide to Dominating Local Search and Attracting Nearby Customers
Professional local SEO services in the Philippines help businesses dominate local search results, connecting them with nearby customers actively searching for their products and services.
On-Page vs Off-Page SEO Explained: Understanding the Two Pillars of Search Engine Optimization
Understanding the fundamental differences between on-page and off-page SEO is essential for developing a comprehensive search engine optimization strategy that delivers sustainable results.
WordPress Maintenance Checklist for Business Owners: Essential Guide to Website Performance, Security, and Growth
Discover the comprehensive WordPress maintenance checklist every business owner needs to protect their website investment, ensure peak performance, and maintain a competitive advantage in the digital marketplace.

WordPress Migration and Setup Services: Complete Guide to Seamless Website Transitions, Professional Implementation, and Business Growth Strategies
Comprehensive guide to WordPress migration and setup services that ensure smooth transitions, protect business data, and establish high-performing websites optimized for growth and success.


